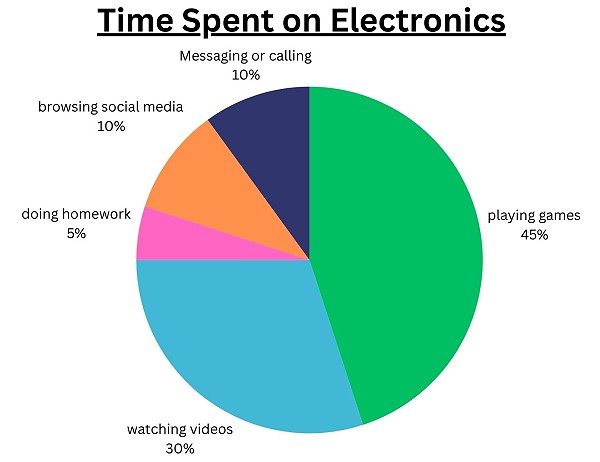
Time Spent on Electronics Graph 04
This practice vocabulary exam for O-NET was prepared by the English Language Institute.
What activity takes up the most time spent on electronics?
- Watching videos
- Playing games
- Messaging or calling
- Browsing social media
What percentage of time is spent on watching videos?
- 25%
- 45%
- 30%
- 10%
Which two activities share the same percentage of time?
- Watching videos and playing games
- Messaging or calling and browsing social media
- Doing homework and messaging or calling
- Playing games and browsing social media
What percentage of time is spent on doing homework?
- 10%
- 15%
- 5%
- 20%
How much more time is spent on playing games compared to doing homework?
- 40%
- 20%
- 30%
- 45%
Which activity takes up the least amount of time?
- Doing homework
- Messaging or calling
- Browsing social media
- Watching videos
- 20%
- 15%
- 25%
- 30%
Which statement about the graph is correct?
- Playing games takes up less than 30% of the total time.
- Watching videos takes up the same percentage as browsing social media.
- Messaging or calling and browsing social media each take up 10% of the time.
- Doing homework takes up the second most time.
Which statement about the graph is incorrect?
- Playing games takes up 45% of the time.
- Watching videos takes up 30% of the time.
- Doing homework takes up more time than browsing social media.
- Messaging or calling takes up 10% of the time.
If students spent 4 hours on electronics in a day, how much time would they spend watching videos?
- 1 hour
- 1.2 hours
- 1.5 hours
- 2 hours


